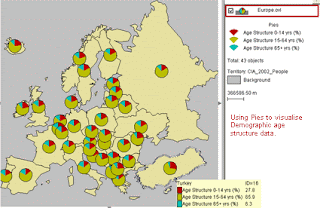
A continuously variable proportional circle map is like the range graded one in that it uses circles to portray a set of data, however there are more things going on in a continuous variable proportional circle map. There are more variables in this instead of just one. The larger the circle means there are more people within the population. Inside the circle, more variables of data are represented. In the above map of France, the inside of the circles compare the different types of meat distributed to Paris from different regions of France.
No comments:
Post a Comment