http://mentalcharlois.wordpress.com/2010/02/15/the-mental-maps/
A mental map can be any one's recollection of a place or pretty much anything for that matter. Their personal point of view of the world can be a mental map. In the picture above, a young girl Cristina tried to accurately draw her neighborhood and immediate surroundings on a piece of paper. This would be an example of a mental map.
Monday, April 2, 2012
Flow Maps
http://www.mekongmigration.org/?page_id=25
Flow maps show the movement of a particular set of data from place to place. It could show the flow of money, communication, data, and in the case of the picture above, labor migration in the greater mekong sub-region.
Cartograms
http://news.bbc.co.uk/2/hi/8280657.stm
A cartogram is a type of map that that shows certain attributes of geographic aspects as their area. The shape and size of the area is distorted to show the data that it is trying to convey. Any conventional map would would show the size shape and geometry according to its actual land mass. But as you see in the map above, the size and shape is greatly distorted because it is a cartogram according to population density in Great Britain. As you can see, the most populous area is London.
Cartographic Animations
http://www.blippitt.com/hurricane-irene-heads-toward-u-s-video-projected-path/
Cartographic animations are used to show how things happen over some span of time. They are often used on weather and news channels to show what to expect with the weather or projected pathways and movements of storms and hurricanes. The cartographic animation above shows the projected path of hurricane Irene as it makes its way to Cuba and the southeastern United States.
Infrared Aerial photo
http://www.stxmaps.com/go/brown-and-root-flats.html
Just like black and white aerial photographs, infrared photographs are taken either from airplanes or satellites above earth. Infrared photography is extremely sensitive to changes in temperature and can be used as thermal imaging. Specific vegetation, water usage, and different kinds of land can be identified using the special infrared lenses. The above picture was taken from a satellite of southern Texas.
Doppler Radar
http://www.noaanews.noaa.gov/stories/s1192.htm
Doppler Radar is a radar primarily used in weather forecasting which uses the doppler effect to display velocity data of wind speeds by taking both the linear and radial velocities of a weather system. It does this by sending pulses of radiation. This is what produces the circular image of the hurricane seen above in a doppler radar of hurricane Claudette on the coast of Texas in 2003. As you can see, the eye of the hurricane is just north of Corpus Christi up the coast.
LIDAR
http://www.extension.org/pages/9689/lidar-derived-products
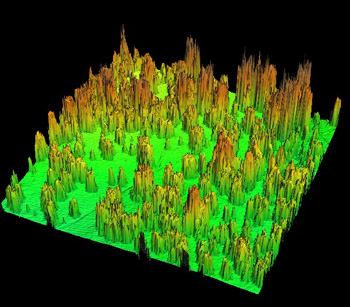
LIDAR, or Light Detection and Ranging, is an optical remote sensing technology that uses light to detect distances to an object and other properties of that target. This is done using pulses from a laser. LIDAR has applications in the fields of physics, geology, the military, geography and archeology among many other fields. Flood risk assessments have been increasingly using LIDAR as well because of the highly accurate landscape and elevation characteristics LIDAR provides as such in the picture above.
Subscribe to:
Posts (Atom)